Sky Map Plotting (ligo.skymap.plot.allsky)
Axes subclasses for astronomical mapmaking.
This module adds several astropy.visualization.wcsaxes.WCSAxes
subclasses to the Matplotlib projection registry. The projections have names of
the form astro_or_geo_or_galactic [lon_units] projection.
astro_or_geo_or_galactic may be astro, geo, or galactic.
It controls the reference frame, either celestial (ICRS), terrestrial (ITRS),
or galactic.
lon_units may be hours or degrees. It controls the units of
the longitude axis. If omitted, astro implies hours and geo implies
degrees.
projection may be any of the following:
aitofffor the Aitoff all-sky projectionmollweidefor the Mollweide all-sky projectionglobefor an orthographic projection, like the three-dimensional view of the Earth from a distant satellitezoomfor a gnomonic projection suitable for visualizing small zoomed-in patches
All projections support the center argument, while some support additional
arguments. The globe projections also support the rotate argument, and
the zoom projections also supports the radius and rotate arguments.
Examples
import ligo.skymap.plot
from matplotlib import pyplot as plt
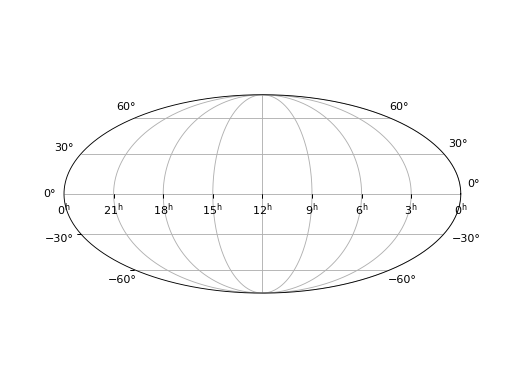
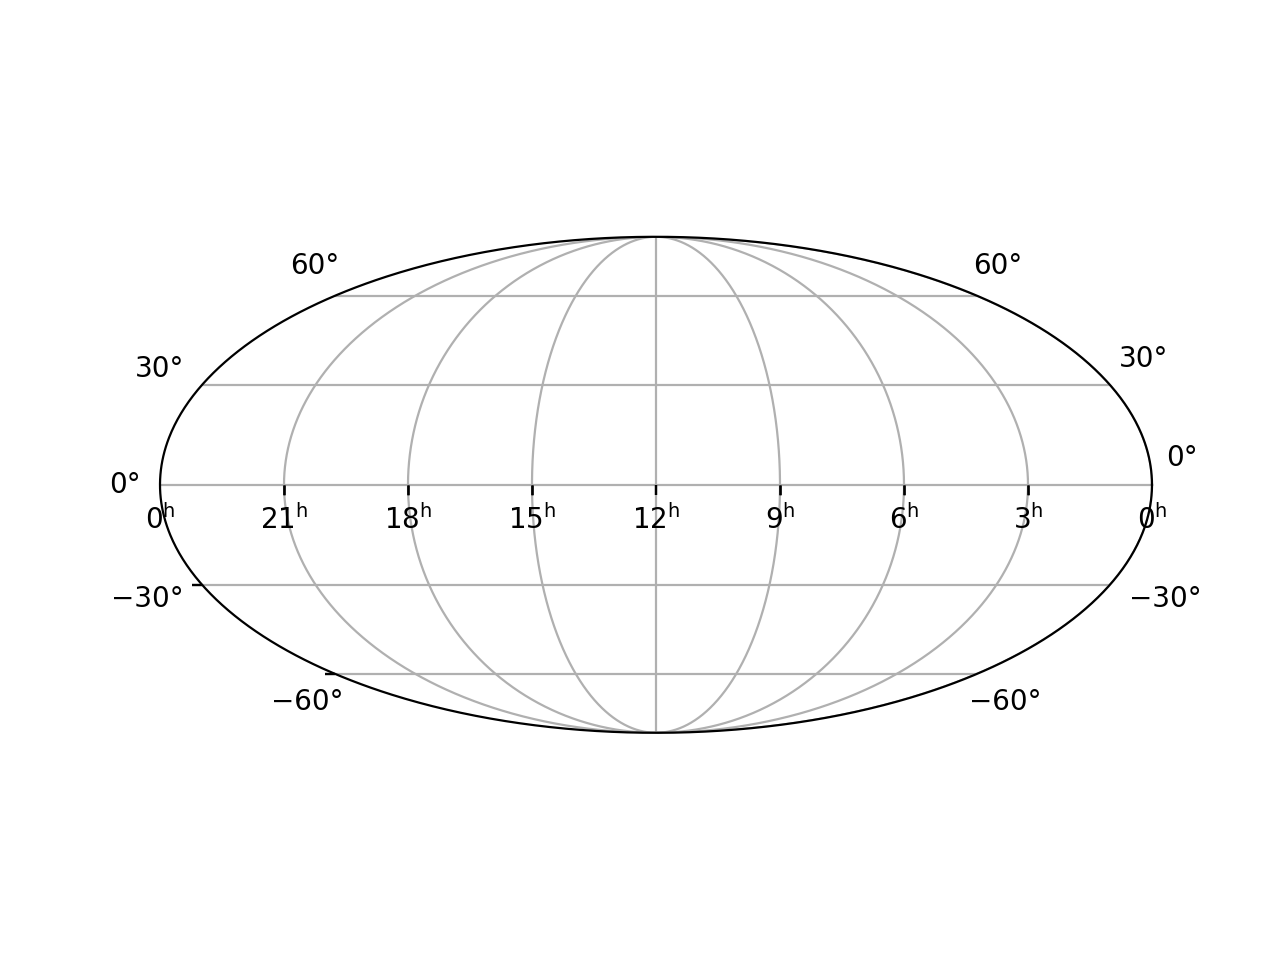
ax = plt.axes(projection='astro hours mollweide')
ax.grid()
(Source code, png, hires.png, pdf)

import ligo.skymap.plot
from matplotlib import pyplot as plt
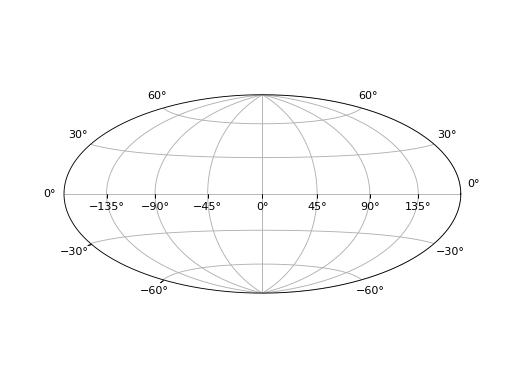
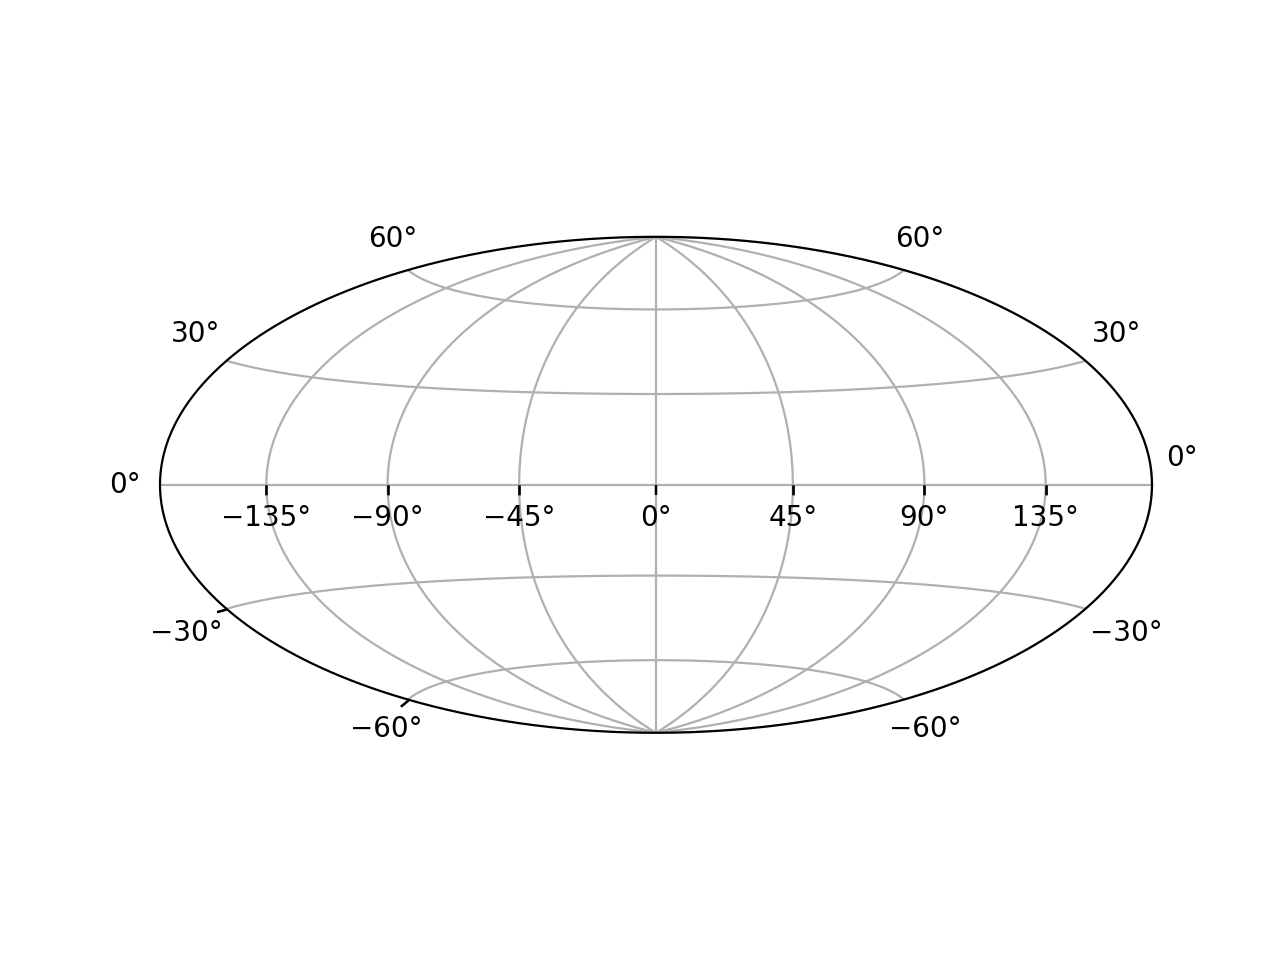
ax = plt.axes(projection='geo aitoff')
ax.grid()
(Source code, png, hires.png, pdf)

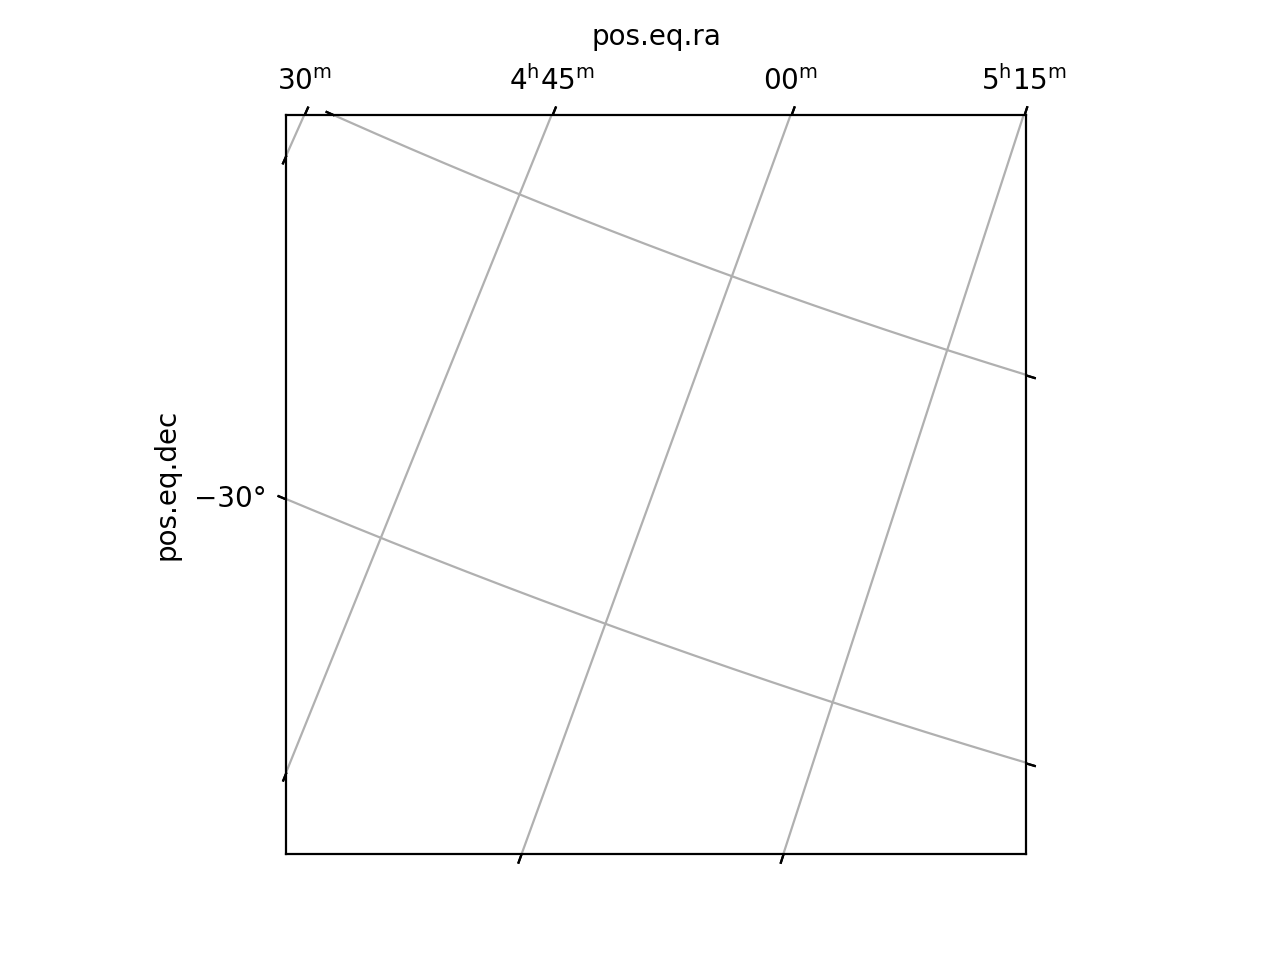
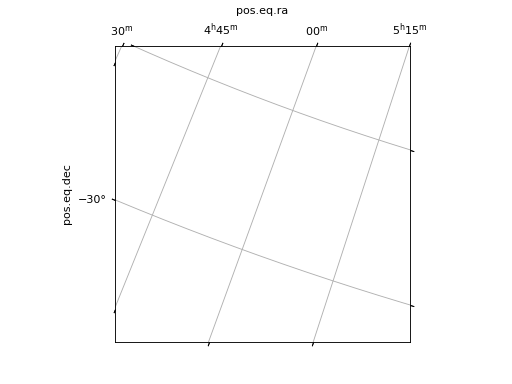
import ligo.skymap.plot
from matplotlib import pyplot as plt
ax = plt.axes(projection='astro zoom',
              center='5h -32d', radius='5 deg', rotate='20 deg')
ax.grid()
(Source code, png, hires.png, pdf)
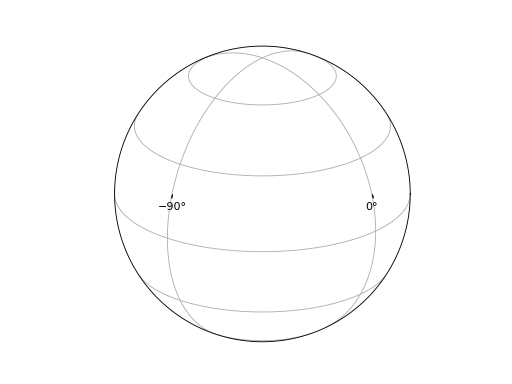
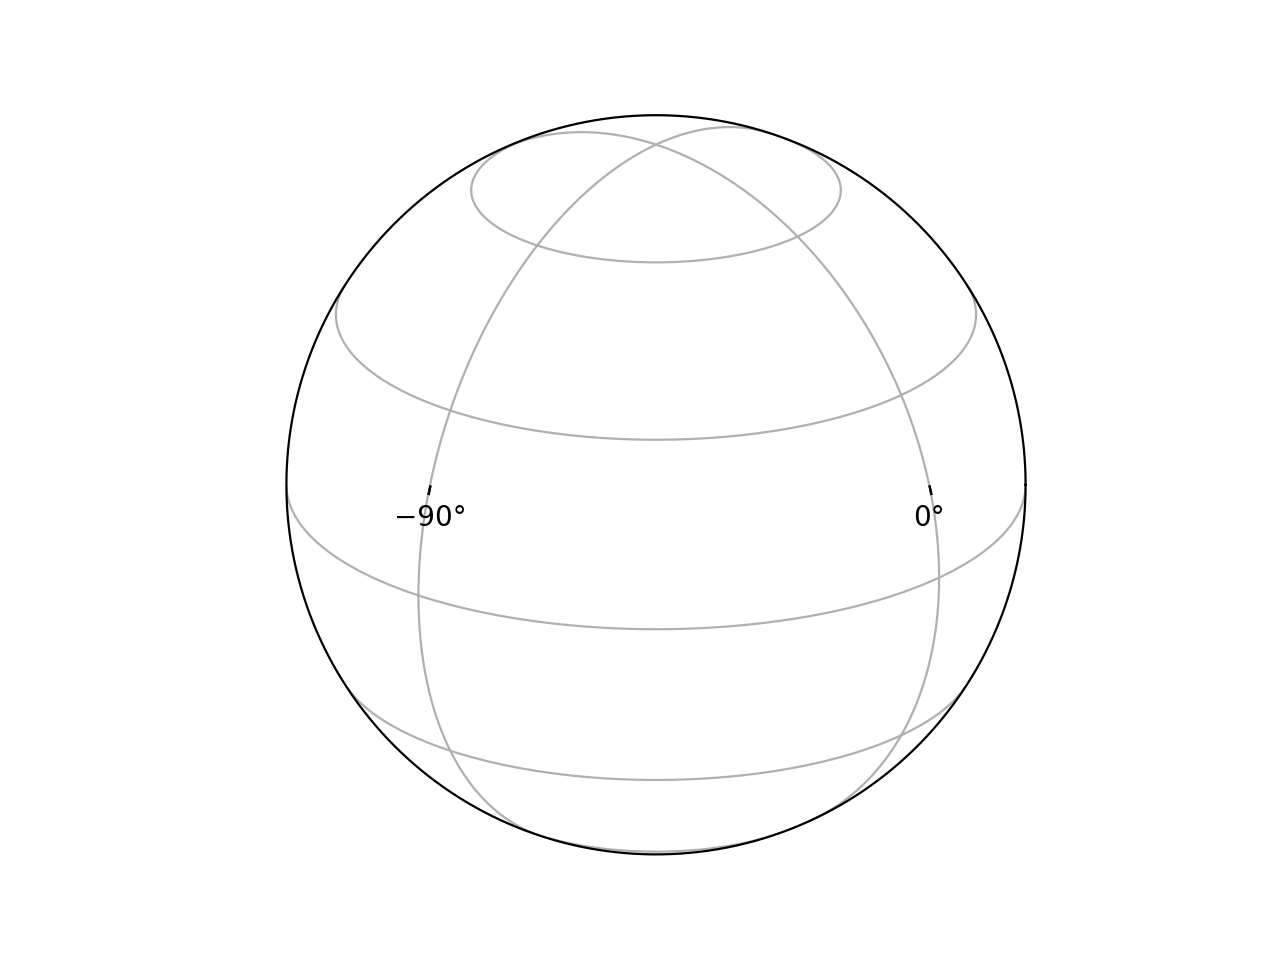
import ligo.skymap.plot
from matplotlib import pyplot as plt
ax = plt.axes(projection='geo globe', center='-50d +23d')
ax.grid()
(Source code, png, hires.png, pdf)

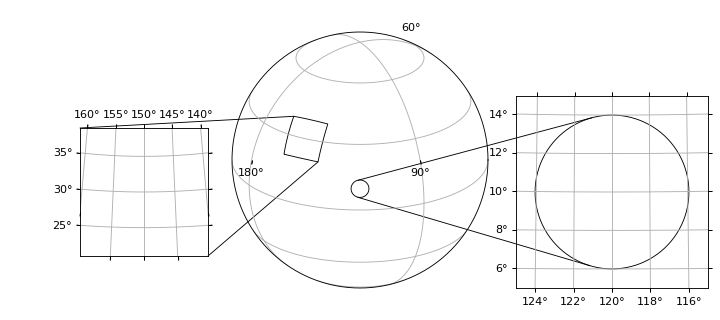
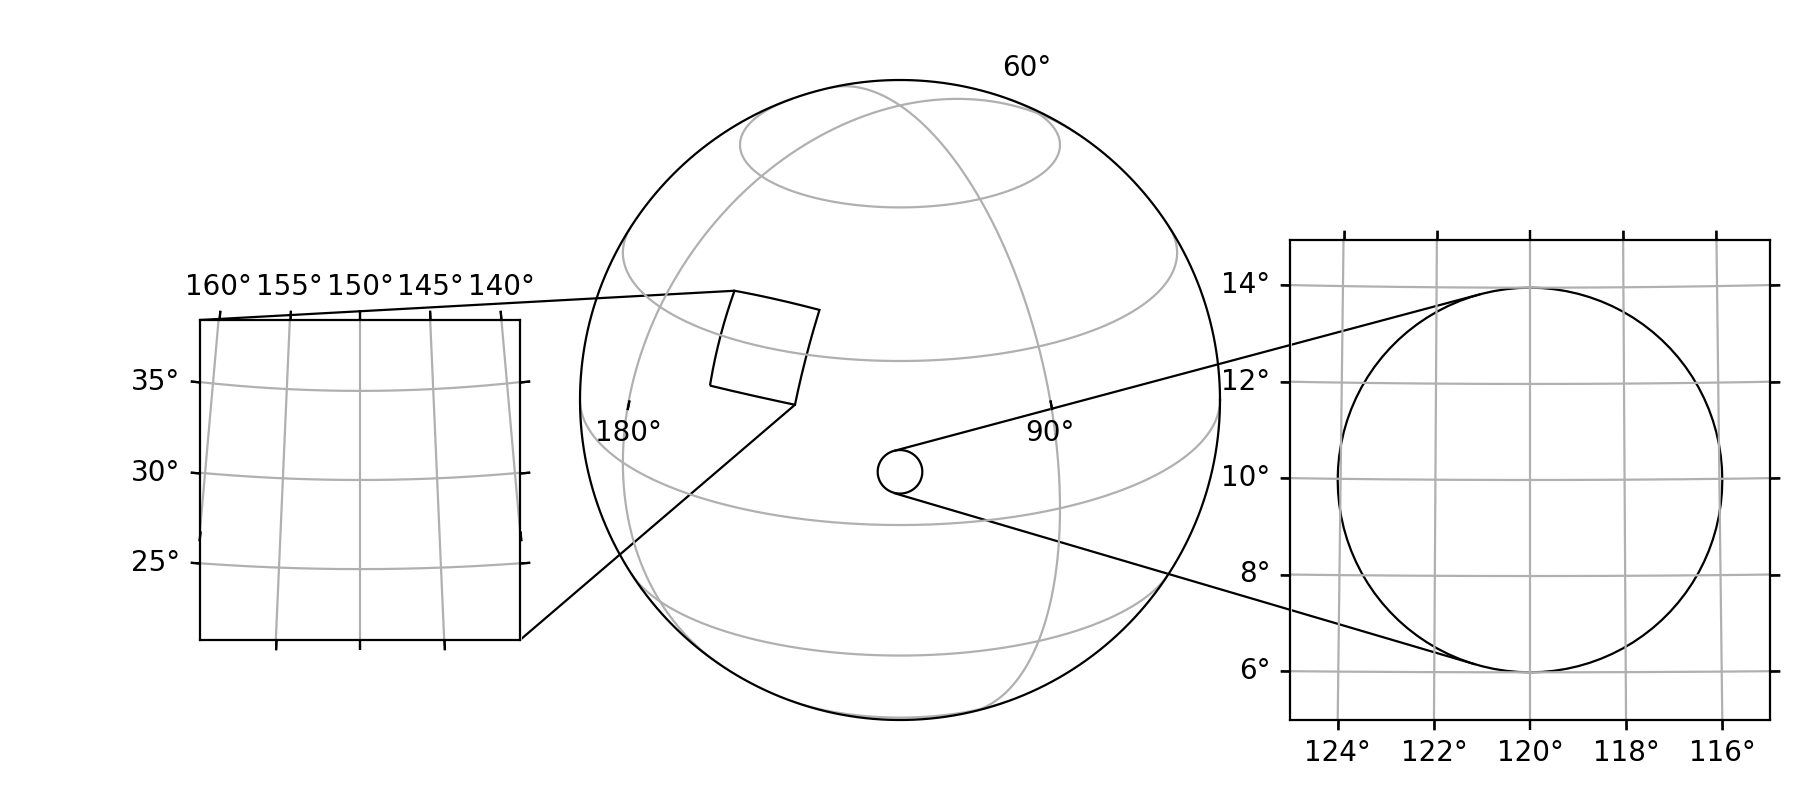
Insets
You can use insets to link zoom-in views between axes. There are two supported styles of insets: rectangular and circular (loupe). The example below shows both kinds of insets.
import ligo.skymap.plot
from matplotlib import pyplot as plt
fig = plt.figure(figsize=(9, 4), dpi=100)

ax_globe = plt.axes(
    [0.1, 0.1, 0.8, 0.8],
    projection='astro degrees globe',
    center='120d +23d')

ax_zoom_rect = plt.axes(
    [0.0, 0.2, 0.4, 0.4],
    projection='astro degrees zoom',
    center='150d +30d',
    radius='9 deg')

ax_zoom_circle = plt.axes(
    [0.55, 0.1, 0.6, 0.6],
    projection='astro degrees zoom',
    center='120d +10d',
    radius='5 deg')

ax_globe.mark_inset_axes(ax_zoom_rect)
ax_globe.connect_inset_axes(ax_zoom_rect, 'upper left')
ax_globe.connect_inset_axes(ax_zoom_rect, 'lower right')

ax_globe.mark_inset_circle(ax_zoom_circle, '120d +10d', '4 deg')
ax_globe.connect_inset_circle(ax_zoom_circle, '120d +10d', '4 deg')

ax_globe.grid()
ax_zoom_rect.grid()
ax_zoom_circle.grid()

for ax in [ax_globe, ax_zoom_rect, ax_zoom_circle]:
    ax.set_facecolor('none')
    for key in ['ra', 'dec']:
        ax.coords[key].set_auto_axislabel(False)
(Source code, png, hires.png, pdf)

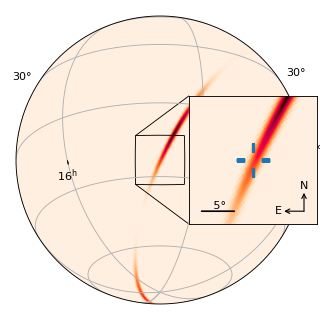
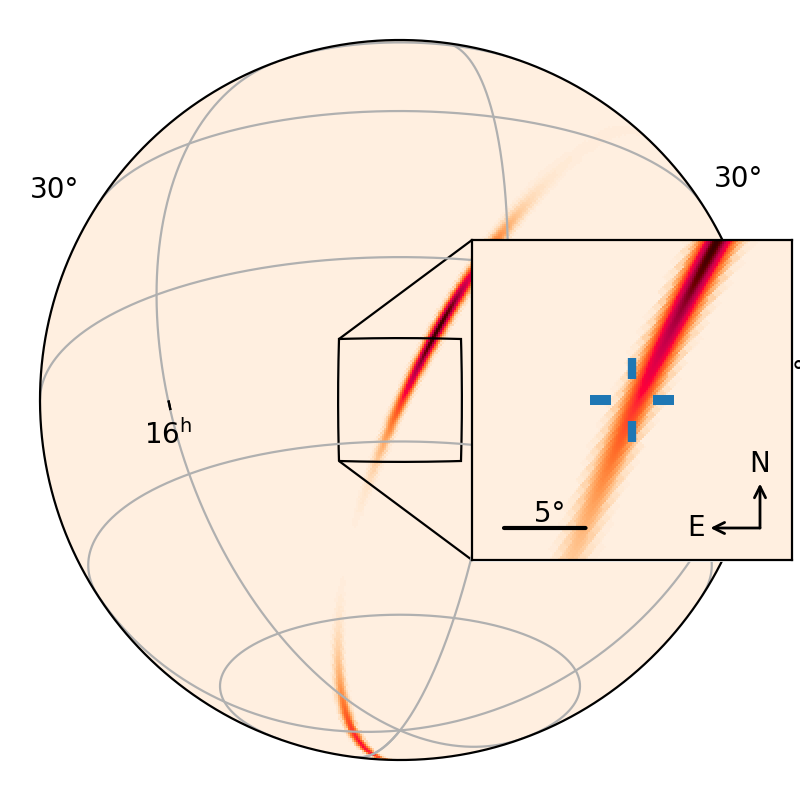
Complete Example
The following example demonstrates most of the features of this module.
from astropy.coordinates import SkyCoord
from astropy.io import fits
from astropy import units as u
import ligo.skymap.plot
from matplotlib import pyplot as plt

url = 'https://dcc.ligo.org/public/0146/G1701985/001/bayestar_no_virgo.fits.gz'
center = SkyCoord.from_name('NGC 4993')

fig = plt.figure(figsize=(4, 4), dpi=100)

ax = plt.axes(
    [0.05, 0.05, 0.9, 0.9],
    projection='astro globe',
    center=center)

ax_inset = plt.axes(
    [0.59, 0.3, 0.4, 0.4],
    projection='astro zoom',
    center=center,
    radius=10*u.deg)

for key in ['ra', 'dec']:
    ax_inset.coords[key].set_ticklabel_visible(False)
    ax_inset.coords[key].set_ticks_visible(False)
ax.grid()
ax.mark_inset_axes(ax_inset)
ax.connect_inset_axes(ax_inset, 'upper left')
ax.connect_inset_axes(ax_inset, 'lower left')
ax_inset.scalebar((0.1, 0.1), 5 * u.deg).label()
ax_inset.compass(0.9, 0.1, 0.2)

ax.imshow_hpx(url, cmap='cylon')
ax_inset.imshow_hpx(url, cmap='cylon')
ax_inset.plot(
    center.ra.deg, center.dec.deg,
    transform=ax_inset.get_transform('world'),
    marker=ligo.skymap.plot.reticle(),
    markersize=30,
    markeredgewidth=3)
(Source code, png, hires.png, pdf)

- class ligo.skymap.plot.allsky.AutoScaledWCSAxes(*args, header, obstime=None, center=None, **kwargs)[source]
Bases:
WCSAxesAxes base class. The pixel scale is adjusted to the DPI of the image, and there are a variety of convenience methods.
- compass(x, y, size)[source]
Add a compass to indicate the north and east directions.
- Parameters:
- x, yfloat
Position of compass vertex in axes coordinates.
- sizefloat
Size of compass in axes coordinates.
- connect_inset_axes(ax, loc, *args, **kwargs)[source]
Connect a corner of another WCSAxes to the matching point inside this one.
- Parameters:
- ax
astropy.visualization.wcsaxes.WCSAxes The other axes.
- locint, str
Which corner to connect. For valid values, see
matplotlib.offsetbox.AnchoredOffsetbox.
- ax
- Returns:
- Other Parameters:
- args
Extra arguments for
matplotlib.patches.ConnectionPatch- kwargs
Extra keyword arguments for
matplotlib.patches.ConnectionPatch
- connect_inset_circle(ax, center, radius, *args, **kwargs)[source]
Connect a circle in this and another Axes to create a loupe.
- Parameters:
- ax
astropy.visualization.wcsaxes.WCSAxes The other axes.
- coord
astropy.coordinates.SkyCoord The center of the circle.
- radius
astropy.units.Quantity The radius of the circle in units that are compatible with degrees.
- ax
- Returns:
- patch1, patch2
matplotlib.patches.ConnectionPatch The two connecting patches.
- patch1, patch2
- Other Parameters:
- args
Extra arguments for
matplotlib.patches.PathPatch- kwargs
Extra keyword arguments for
matplotlib.patches.PathPatch
- contour_hpx(data, hdu_in=None, order='bilinear', nested=False, field=0, smooth=None, **kwargs)[source]
Add contour levels for a HEALPix data set.
- Parameters:
- data
numpy.ndarrayor str orTableHDUorBinTableHDUor tuple The HEALPix data set. If this is a
numpy.ndarray, then it is interpreted as the HEALPix array in the same coordinate system as the axes. Otherwise, the input data can be any type that is understood byreproject.reproject_from_healpix.- smooth
astropy.units.Quantity, optional An optional smoothing length in angle-compatible units.
- data
- Returns:
- Other Parameters:
- hdu_in, order, nested, field, smooth
Extra arguments for
reproject.reproject_from_healpix- kwargs
Extra keyword arguments for
matplotlib.axes.Axes.contour
- contourf_hpx(data, hdu_in=None, order='bilinear', nested=False, field=0, smooth=None, **kwargs)[source]
Add filled contour levels for a HEALPix data set.
- Parameters:
- data
numpy.ndarrayor str orTableHDUorBinTableHDUor tuple The HEALPix data set. If this is a
numpy.ndarray, then it is interpreted as the HEALPix array in the same coordinate system as the axes. Otherwise, the input data can be any type that is understood byreproject.reproject_from_healpix.- smooth
astropy.units.Quantity, optional An optional smoothing length in angle-compatible units.
- data
- Returns:
- Other Parameters:
- hdu_in, order, nested, field, smooth
Extra arguments for
reproject.reproject_from_healpix- kwargs
Extra keyword arguments for
matplotlib.axes.Axes.contour
- imshow_hpx(data, hdu_in=None, order='bilinear', nested=False, field=0, smooth=None, **kwargs)[source]
Add an image for a HEALPix data set.
- Parameters:
- data
numpy.ndarrayor str orTableHDUorBinTableHDUor tuple The HEALPix data set. If this is a
numpy.ndarray, then it is interpreted as the HEALPix array in the same coordinate system as the axes. Otherwise, the input data can be any type that is understood byreproject.reproject_from_healpix.- smooth
astropy.units.Quantity, optional An optional smoothing length in angle-compatible units.
- data
- Returns:
- Other Parameters:
- hdu_in, order, nested, field, smooth
Extra arguments for
reproject.reproject_from_healpix- kwargs
Extra keyword arguments for
matplotlib.axes.Axes.contour
- mark_inset_axes(ax, *args, **kwargs)[source]
Outline the footprint of another WCSAxes inside this one.
- Parameters:
- ax
astropy.visualization.wcsaxes.WCSAxes The other axes.
- ax
- Returns:
- Other Parameters:
- args
Extra arguments for
matplotlib.patches.PathPatch- kwargs
Extra keyword arguments for
matplotlib.patches.PathPatch
- mark_inset_circle(ax, center, radius, *args, **kwargs)[source]
Outline a circle in this and another Axes to create a loupe.
- Parameters:
- ax
astropy.visualization.wcsaxes.WCSAxes The other axes.
- coord
astropy.coordinates.SkyCoord The center of the circle.
- radius
astropy.units.Quantity The radius of the circle in units that are compatible with degrees.
- ax
- Returns:
- patch1
matplotlib.patches.PathPatch The outline of the circle in these Axes.
- patch2
matplotlib.patches.PathPatch The outline of the circle in the other Axes.
- patch1
- Other Parameters:
- args
Extra arguments for
matplotlib.patches.PathPatch- kwargs
Extra keyword arguments for
matplotlib.patches.PathPatch
- scalebar(*args, **kwargs)[source]
Add scale bar.
- Parameters:
- xytuple
The axes coordinates of the scale bar.
- length
astropy.units.Quantity The length of the scale bar in angle-compatible units.
- Returns:
- Other Parameters:
- args
Extra arguments for
matplotlib.patches.FancyArrowPatch- kwargs
Extra keyword arguments for
matplotlib.patches.FancyArrowPatch
- set(*, adjustable=<UNSET>, agg_filter=<UNSET>, alpha=<UNSET>, anchor=<UNSET>, animated=<UNSET>, aspect=<UNSET>, autoscale_on=<UNSET>, autoscalex_on=<UNSET>, autoscaley_on=<UNSET>, axes_locator=<UNSET>, axisbelow=<UNSET>, box_aspect=<UNSET>, clip_box=<UNSET>, clip_on=<UNSET>, clip_path=<UNSET>, facecolor=<UNSET>, forward_navigation_events=<UNSET>, frame_on=<UNSET>, gid=<UNSET>, in_layout=<UNSET>, label=<UNSET>, mouseover=<UNSET>, navigate=<UNSET>, path_effects=<UNSET>, picker=<UNSET>, position=<UNSET>, prop_cycle=<UNSET>, rasterization_zorder=<UNSET>, rasterized=<UNSET>, sketch_params=<UNSET>, snap=<UNSET>, subplotspec=<UNSET>, title=<UNSET>, transform=<UNSET>, url=<UNSET>, visible=<UNSET>, xbound=<UNSET>, xlabel=<UNSET>, xlim=<UNSET>, xmargin=<UNSET>, xscale=<UNSET>, xticklabels=<UNSET>, xticks=<UNSET>, ybound=<UNSET>, ylabel=<UNSET>, ylim=<UNSET>, ymargin=<UNSET>, yscale=<UNSET>, yticklabels=<UNSET>, yticks=<UNSET>, zorder=<UNSET>)
Set multiple properties at once.
Supported properties are
- Properties:
adjustable: {‘box’, ‘datalim’} agg_filter: a filter function, which takes a (m, n, 3) float array and a dpi value, and returns a (m, n, 3) array and two offsets from the bottom left corner of the image alpha: float or None anchor: (float, float) or {‘C’, ‘SW’, ‘S’, ‘SE’, ‘E’, ‘NE’, …} animated: bool aspect: {‘auto’, ‘equal’} or float autoscale_on: bool autoscalex_on: unknown autoscaley_on: unknown axes_locator: Callable[[Axes, Renderer], Bbox] axisbelow: bool or ‘line’ box_aspect: float or None clip_box:
BboxBaseor None clip_on: bool clip_path: Patch or (Path, Transform) or None facecolor or fc: color figure:FigureorSubFigureforward_navigation_events: bool or “auto” frame_on: bool gid: str in_layout: bool label: object mouseover: bool navigate: bool navigate_mode: unknown path_effects: list ofAbstractPathEffectpicker: None or bool or float or callable position: [left, bottom, width, height] orBboxprop_cycle:Cyclerrasterization_zorder: float or None rasterized: bool sketch_params: (scale: float, length: float, randomness: float) snap: bool or None subplotspec: unknown title: str transform:Transformurl: str visible: bool xbound: (lower: float, upper: float) xlabel: unknown xlim: (left: float, right: float) xmargin: float greater than -0.5 xscale: unknown xticklabels: unknown xticks: unknown ybound: (lower: float, upper: float) ylabel: unknown ylim: (bottom: float, top: float) ymargin: float greater than -0.5 yscale: unknown yticklabels: unknown yticks: unknown zorder: float